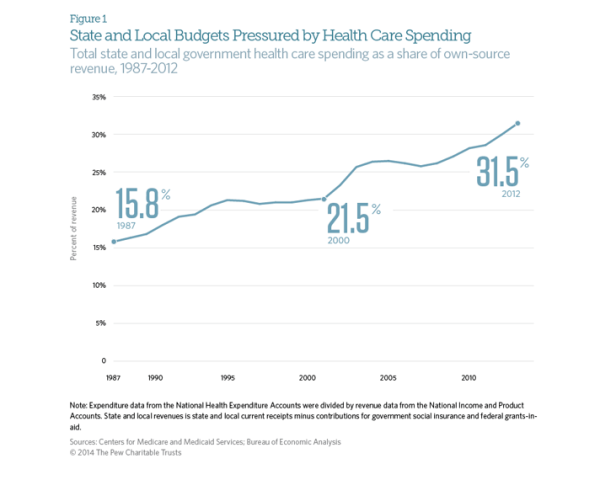
The Affordable Care Act was supposed to stem the rapidly rising cost of healthcare in the United States. While costs have continued to rise since the ACA’s passage in 2010, the rate has slowed dramatically. Early indicators suggest that the growth rate of total healthcare spending in the US was only 4% in 2012. This is an improvement when looking at the aggregate expenditures, unfortunately, for state and local governments, the cost curve has not had any form of reduction. According to CMS and the Bureau of Economic Analysis, state and local governments spent 31.5% of their budgets on healthcare costs in 2012. That represents an 8 percent increase over the previous year, or a rate twice as fast as the national rate of increase. This increase is largely due in part to the stimulus bill passed by Congress in 2009. The American recovery and Reinvestment Act granted more than $100 billion to states to cover increasing Medicaid costs, which had ballooned during the recession as high unemployment drove job-seekers to the government run health program. During this period, even though Medicaid saw increased participants, overall state spending on Mediciad actually fell. However, the federal stimulus money would not last forever and State Mediciad expenditures rose 22 percent between 2010 and 2011, and another 15 percent in 2012. The Government Accountability Office says health-care spending represents the single greatest threat to state and local government long-term health.
Medical Billing Blog
State and Local Governments Spend 31.5% on Healthcare
Marketplace Enrollment Update: January 2014
Approximately 3 million people have now enrolled in health insurance plans sold through marketplaces created by President Obama’s health law, the administration announced Friday. The milestone indicates nearly a million additional people have signed up since the end of December. It also suggests that the marketplaces are continuing to recover from a disastrous launch on Oct. 1. That still leaves the Obama administration lagging behind its initial projections for overall health law enrollment--but also closer to hitting monthly sign-up expectations it set back in September. The numbers are reassuring for supporters of the Affordable Care Act, who were worried that the pace of sign-ups for private plans would slow in January and February, before picking up again as the March 31 enrollment deadline for 2014 coverage approached. But they are still shy of initial projections from the Centers for Medicare and Medicaid Services, which originally expected 4.4 million people to sign up for a plan by the end of January. Moreover, the administration has not provided data on how many of the people who have signed up for plans through the exchanges have actually made a payment, which is required to ensure coverage.
CMS issues 2014 Outpatient Facility Policy and Payment Changes
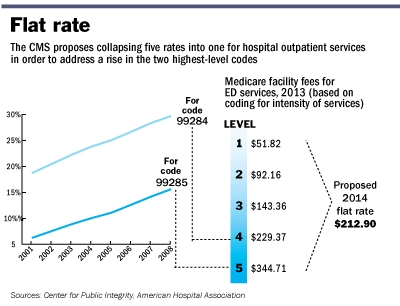
Last November, CMS released a final CY 2014 hospital outpatient and ambulatory surgical center (ASC) payment Final Rule. Most significantly, “CMS will replace the current five levels of hospital clinic visit codes for both new and established patients with a single code describing all outpatient clinic visits.” CMS believes that a single code and payment is administratively simpler for hospitals and “better reflects hospital resources involved in supporting an outpatient visit.”
On December 13,CMS released the Physician Quality Reporting System (PQRS) measure documents for 2014. You are advised that some of these measures may be different from the PQRS measure documents of prior years.
MBR Explains: Increasing Access - Key Features of the Affordable Care Act by Year -- 2010
Continuing our series on the key features of the Affordable Care Act, we will now look into the changes that took effect in 2010 that sought to increase access to affordable healthcare. As previously mentioned, the Patient Protection and Affordable Care Act was signed by President Obama on March 23, 2010. The law aims to increase the quality and affordability of health insurance, lower the uninsured rate, and reduce the costs of healthcare for individuals and the government. However, a number of the mechanisms – mandates, subsidies, and insurance exchanges – are to be rolled out over four years and beyond. Below is an overview of some of the key provisions aimed to increase access that took effect in 2010.
MBR Explains: The Hospital Value-Based Purchasing Program
Historically, the United Stateshas paid for its healthcare under a fee-for-service (FFS) model. Every visit, test, procedure, and consultation receives an individual fee. It incentivizes volume over quality. It discourages integrated care. And it contributes toAmerica’s high health care expenditures. There have been many attempts to reform our payment system – bundled payments, capitation, episode of care payment, comprehensive care payment – but as of 2009, no state has successfully eliminated the FFS system.
MBR Explains: Quality Improvements - Key Features of the Affordable Care Act by Year -- 2010
Continuing our series on the key features of the Affordable Care Act, we will now look into the changes that took effect in 2010 that sought to improve quality and lower cost of healthcare. As previously mentioned, the Patient Protection and Affordable Care Act was signed by President Obama on March 23, 2010. The law aims to increase the quality and affordability of health insurance, lower the uninsured rate, and reduce the costs of healthcare for individuals and the government. However, a number of the mechanisms – mandates, subsidies, and insurance exchanges – are to be rolled out over four years and beyond. Below is an overview of some of the key quality improvement provisions that took effect in 2010.
MBR Explains: Coverage - Key Features of the Affordable Care Act by Year -- 2010
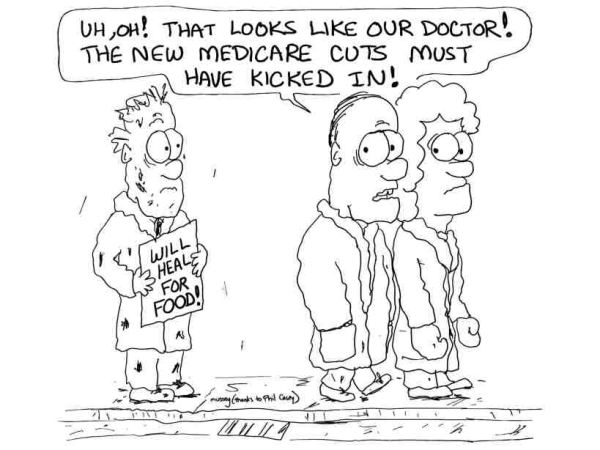
The Medicare Sustainable Growth Rate (SGR) is the current method used by the Centers for Medicare and Medicaid Services (CMS) to control spending by Medicare on physician services, through ensuring that the yearly increase in the expense per Medicare beneficiary does not exceed the growth in GDP. It was introduced in 1997 as part of the Balanced Budget Act of 1997. And, for the first couple years, it worked relatively well. That is because Medicare expenditures in those years did not exceed the target amount, allowing doctors to receive modest pay increases. But in 2002, the situation changed. Medicare expenditures exceeded the target expenditures set in the previous year, so Congress was required by statute to balance payments to match the target SGR. Doctors across the nation reacted with contempt as Congress attempted to enact a 4.8% pay cut. Congress eventually relented and passed stopgap legislation to prevent the scheduled cut, thereby temporarily suspending the reduction for a matter of weeks. Weeks then turned into months and months into years, and now physicians face a 26.5% cut under the SGR. Virtually no one believes Congress will allow the SGR to lower pay by such an amount, but doctors have sent a strong message to lawmakers that the annual ritual of enacting a last minute, transitory solution that only defers the increase to a later date needs to stop.

